
Major data revisions are coming
That should make you trust official statistics more

Today’s post is from economist Jed Kolko, who writes a monthly column for Slow Boring (you can read last month’s column here). Jed served for two years as Under Secretary for Economic Affairs in the Department of Commerce, where he oversaw the Census Bureau and the Bureau of Economic Analysis. He was previously chief economist at Indeed and Trulia.
Next month, the jobs report will incorporate its annual benchmark revision, which will meaningfully change some key economic statistics and will solve some nagging puzzles and misconceptions about the labor market. Data revisions are how the government balances timeliness and accuracy: Higher-quality data take more time to collect, and policymakers and businesses can’t fly blind waiting for perfect data.
US statistical agencies handle revisions the right way, with advance warning, transparency, and best-faith efforts to preserve historical comparability.
But data revisions also cause confusion and sometimes fuel conspiracy theories.
Revisions can be a headache for policymakers who need to make urgent decisions about interest rates, federal spending, or taxes based on data that could substantively change. Revisions can even shift the economic narrative — only last September did we learn that Gross Domestic Product did NOT fall for two consecutive quarters back in 2022 (a common but unofficial recession indicator). Revisions can also foment distrust in federal statistics, leading sometimes to constructive debate and sometimes to accusations that the government is cooking the books. Most alarming, both genuine concerns and unfounded accusations could be used to justify actions, like defunding, political interference, or privatization, that could do real harm to the statistical system.
Data get revised for good reasons, and the US does it the right way
Lots of principal economic indicators get revised in the months (and sometimes years) after their initial release. Most revisions are an attempt to square timeliness and accuracy: Initial data are based on what’s known or available quickly, and revisions incorporate additional inputs or information that take more time to collect or calculate. Here are three reasons for data revisions:
Incorporating additional or corrected information. The Bureau of Labor Statistics revises data from the payroll survey in the monthly jobs report twice after the initial estimate in order to include employers who respond more slowly and to make any corrections. The Bureau of Economic Analysis publishes an advance estimate, a second estimate, and a third estimate of Gross Domestic Product over three consecutive months each quarter in order to incorporate components from other statistical agencies and sources as they become available. Finally, many data series get revised with new seasonal adjustment factors, which are regularly recalculated as new seasonal patterns of economic activity emerge.
Aligning across different datasets. In the annual benchmark revisions to the monthly jobs report, the timely headline datasets are adjusted to align with more accurate datasets that are released later and less frequently — we’ll look in depth at the annual benchmark revision below. Another example is Census population estimates, which are produced and revised each year and then are later revised to align with the next decennial Census. (The annual Census population estimates between 2010 and 2020 were just revised in late 2024 to align with the 2020 decennial Census.) These alignments are often substantial and are necessary to avoid having multiple competing estimates for fundamental statistics like the total population and total employment.
Applying new definitions or methodologies. Every few years, industry, occupation, and geographic definitions get revised as the economy and society change. For instance, data scientists became an official occupation in 2018; non-store retailers, including e-commerce and mail-order houses, ceased to be classified as an industry in 2022; and Connecticut’s eight counties were replaced by nine planning regions in 2022. A major revision to race and ethnicity categories is coming. Methodologies change, too — Census revised its approach for estimating immigration in late 2024.
These are all solid reasons for why data get revised. There are patterns to revisions, too. There’s some evidence that payroll revisions are more positive when the economy is growing faster, for instance. Revisions tend to be larger during economic shocks and surprises, as initial estimates based on historical models turn out not to fit the current reality so well. And as survey response rates decline, revisions that align survey data with lagged but more reliable administrative data could get larger.
Building trust in data revisions is as much about the how as the why; here’s how the US handles revisions in a trust-building way:
Revisions are generally announced far in advance, on set schedules, and using pre-determined methodologies. People who follow economic data closely know what’s coming and what to expect. Below, I am able to explain what will happen next month in the jobs-report revisions only because the timing, method, and some supporting data are made public in advance.
Both initial and revised data are publicly available for inspection and analysis. For instance, you can see all monthly revisions to every monthly jobs report back to 1979; full breakdowns parsing the differences between the advance, second, and third GDP estimates; and every vintage of Census annual population estimates. The statistical agencies analyze these revisions themselves, and outside researchers can assess what factors affect the size and direction of revisions.
Revisions are often (though not always!) applied retroactively to many years of historical data, in order to preserve consistent, smooth time-series. Even when a definitional or methodological change is not applied retroactively, statistical agencies provide documentation of changes so researchers or other data services can produce consistent time-series data.
Of course, revisions can undermine trust in official statistics, depending on how they’re handled. For instance, in mid-2023 China stopped publishing its youth unemployment rate and restarted it a few months later with a new methodology, causing concern among data users. While the methodological change (excluding full-time students from the calculation) seems sensible enough, the change came as a surprise, and the new method was not applied to historical data. Analysts could not assess how the methodological change affected the published numbers. This contrasts the well-telegraphed, transparent, and time-series-preserving approach that the US agencies take.
Brace for big revisions in next month’s jobs report, both upward and downward
The January jobs report (the 2025 version will be released on February 7) is always the most exciting jobs report of the year, because it includes the annual benchmark revision. This year, we expect to see big revisions to both halves of the job report: the payroll survey and the household survey.
The payroll survey gives us the nonfarm payroll change, the most-watched number in the monthly jobs report, as well as average weekly hours and average hourly earnings. It’s based on a survey of employers, covering hundreds of thousands of workplaces. Each year in the benchmark revision, all the data for multiple years are revised in order to align these survey-based data with a more comprehensive count of employment based on administrative records collected by state unemployment-insurance agencies.
We already know that it’s very likely that the payroll employment number will be revised downward next month. The Bureau of Labor Statistics (BLS) published a preliminary benchmark revision in August 2024 that foreshadowed next month’s final benchmark revision: a downward adjustment of 818,000 jobs, which is big by historical standards. You can even use a lesser-known BLS report, the Quarterly Census of Employment and Wages (QCEW), to guess the size of the preliminary revision before it’s released in August since the QCEW is based on those same administrative records.
In short: no one should be surprised by, or distrusting of, a big downward revision to payrolls next month.
On to the household survey, or more formally the Current Population Survey (CPS). The household survey gives us the unemployment rate and other employment measures for the overall workforce as well as by age, race, education level, and other demographics. For this survey, the annual revision is an updated set of population controls, based on Census Bureau population estimates. These population controls are the starting point for calculating the number of employed and unemployed people from the household survey.1
In the real world, the population grows smoothly, at roughly the same rate month-to-month even though that rate can shift up or down over the long term. But the household-survey population controls are updated only annually. Here’s the trend in the US population, according to the household survey’s population controls:
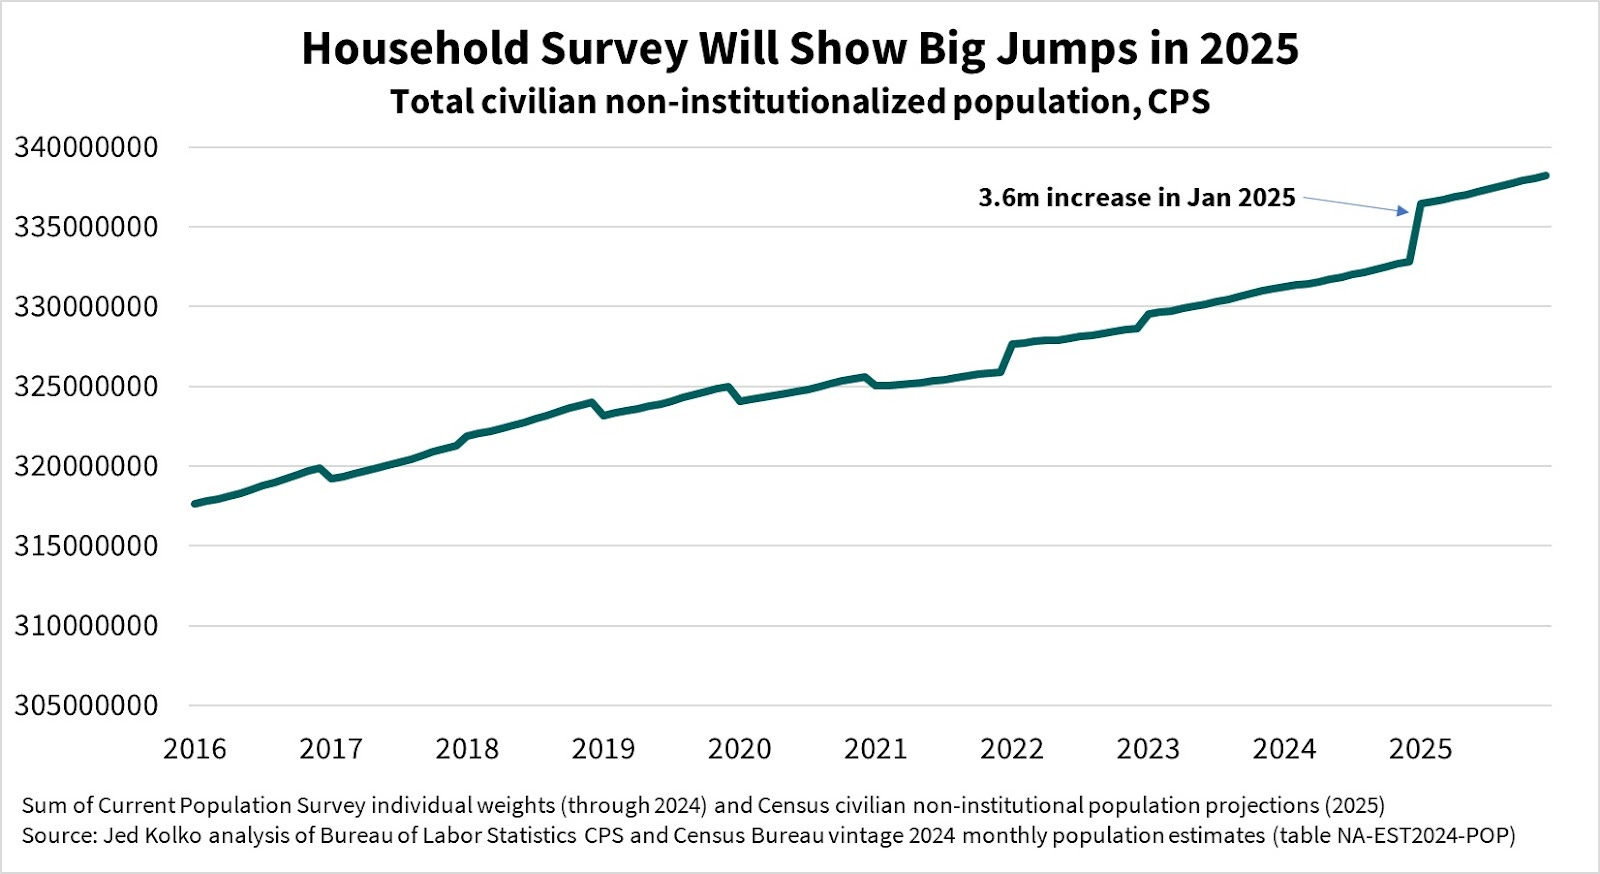
Those weird jerks up and down are the new population controls each January. This time, it’s a huge leap upward, by 3.6 million people! What’s driving this? Last month Census released its latest population estimates, incorporating a new methodology for counting immigrants that resulted in much higher estimates (and moving Census more in line with other prominent estimates).
This big jump in the household survey population controls will substantially change data that are expressed as counts (rather than rates or percentages), such as the number of employed people or the size of the labor force. This will change the labor-market narrative in two ways.
First, a reported decline in native-born employment — which fueled claims that immigrants were taking jobs from native-born workers — might go away entirely and instead show that both native-born and foreign-born employment increased in recent years (as this paper predicted).
Second, this jump in household survey population controls could bring the household and payroll surveys back into alignment. Recently, the two surveys have diverged, with the payroll survey estimating over 4 million more employed people than the household survey in December 2024. A big downward revision to the payroll survey and an even bigger upward revision to the household survey could close much of this gap.2
If you want to worry about the integrity of federal statistics, start here
Well-telegraphed, transparent revisions should not set off alarm bells about the integrity or health of official statistics. But other things should. A recent report, The Nation's Data at Risk, lays out many risks facing the statistical system, including:
Technological and societal shifts. First, survey response rates have declined for nearly all surveys. Second, new techniques and greater private-sector data availability make it easier to identify individual survey respondents through reverse engineering, raising the risk that confidential data is disclosed (there’s a fierce ongoing debate over whether statistical agencies’ new disclosure-prevention techniques go too far). Third, the economy continues to shift away from easier-to-measure activities like making physical stuff to harder-to-measure activities like developing algorithms.
Funding and legal constraints. Insufficient or reduced funding causes statistical agencies to underinvest in innovation or even pare back core products. Earlier this year, for instance, the BLS considered reducing the already-small sample size for the Current Population Survey. Also, limitations on data sharing across the 13 principal statistical agencies (yes, 13!) reduce the quality of federal statistics, introduce inconsistencies across different statistical products, and create duplicative work.
Inappropriate political interference can threaten the autonomy and scientific integrity of the statistical agencies and their products. The Nation’s Data at Risk report gives two recent examples: relocating a statistical agency within the Agriculture Department away from Washington, DC, effectively decimating the agency; and ordering the Census Bureau to add a citizenship question to the decennial Census and to subtract undocumented immigrants from state Congressional apportionment counts. Reclassifying civil servants at the statistical agencies as political appointees could also undermine the integrity of and trust in official statistics; so could choosing political appointees to lead or oversee the agencies based on their political loyalty rather than on their technical and research qualifications.
Internal challenges with communication and user feedback. The Nation’s Data at Risk report notes that the statistical agencies should invest more in user engagement and feedback; I came to the same conclusion when I worked in government. While the agencies have advisory committees that provide technical input on methodology, the agencies have few mechanisms for collecting and analyzing which statistical products are most used and valued, what improvements users would like, and what frustrations users have.
The private sector can help. Already, some inputs into official statistics come from the private sector: Gross Domestic Product incorporates data on car and truck sales, home sales, and oil and gas drilling from private data vendors and industry associations. Policymakers look at and cite job posting trends and home-price indices based on company data. Data from the National Association of Realtors, the Institute for Supply Management, and payroll processor ADP are all part of the canon of closely watched economic indicators. Private sector data are typically based on transaction records and online behaviors, rather than surveys, sidestepping the problem of declining response rates.3
Therefore, the private sector can help fill in some of the gaps in official statistics: Private sector data are often more timely and more detailed than public-sector data. And the private sector has a culture of tracking and responding to user experience that the public sector should emulate.
But the private sector cannot replace official government statistics. Official statistics are well-documented, thoroughly reviewed, transparent, and typically have a long historical time-series and will continue to be produced in the future. Official statistics are produced with a public purpose in mind, adhere to professional and international standards, and are designed to be representative of the whole country. Businesses rely on official government statistics for their own planning. In fact, the researchers who produce private-sector data — including me for many years! — are among the staunchest champions of official statistics, which are essential for benchmarking and validating private-sector data. Private-sector data are a complement, not a substitute, for government data.
The threats to official statistics underscore the need to invest in and protect the federal statistical system, not to privatize or replace it.
This is a simplification. The CPS actually covers only the civilian, non-institutionalized population. Also, Census calculates controls not just for the overall population but also for demographic groups. Weights are calculated and assigned to individual respondents such that the sum of individual weights equals the population controls.
The rates and percentages from the household survey — like the unemployment rate and labor force participation rate — might shift, too. Population controls can change by different amounts for different demographic groups, which can change the composition of the estimated population and therefore some of the rates and percentages when everyone is averaged together. If you want to go deep in the weeds on this, look here and here.
Some government data, as well, are based on administrative records rather than survey data, like the employment counts that the monthly payroll survey is annually benchmarked to. The statistical agencies are exploring ways to further incorporate government administrative data into official statistics.
This and a few other posts over the years are very technical and wonderful as references. They belong in some kind of Slow Boring technocratic archive. Everything You Wanted to Know But Were Too Bored to Ask
"Also, limitations on data sharing across the 13 principal statistical agencies (yes, 13!) reduce the quality of federal statistics, introduce inconsistencies across different statistical products, and create duplicative work."
Attention DOGE: Look for stuff like this.