
Cities aren't back
Urban growth rebounded in 2024, but the pandemic intensified the shift to the suburbs.

Every year, the Census releases local population estimates for counties and metropolitan areas in the US.
The latest release shows that in 2024, urban counties grew at their fastest rate in eleven years. But this doesn’t herald the return of last decade’s (overstated and misunderstood) urban revival. Rather, recent urban growth was driven by a temporary national immigration surge and is likely to reverse:
Both urban residential areas and downtown neighborhoods have grown more slowly since 2019 than before the pandemic, falling farther behind suburban growth in the vast majority of metro areas.
Home prices have risen more slowly in urban than in suburban and rural areas, pointing to a shift in demand away from cities rather than just constrained supply.
The people who led last decade’s urban revival — college-educated young adults without school-age kids — are increasingly choosing suburbs.
The broader story is that the pandemic accelerated the pre-pandemic trend toward suburbanization.
Urban counties rebounded in 2024 thanks to immigration, but their suburbs still grew faster
After losing population in 2020, 2021, and 2022, urban counties rebounded in 2023 and 2024, growing in 2024 at their fastest rate since 2013, according to this morning’s Census Bureau release. Yet their suburbs grew faster. Higher-density suburban growth accelerated in 2024, and, once again, lower-density suburbs of large metropolitan areas were the fastest growing counties, as they have been since 2016, and as they were in the years leading up to the foreclosure crisis in 2007.
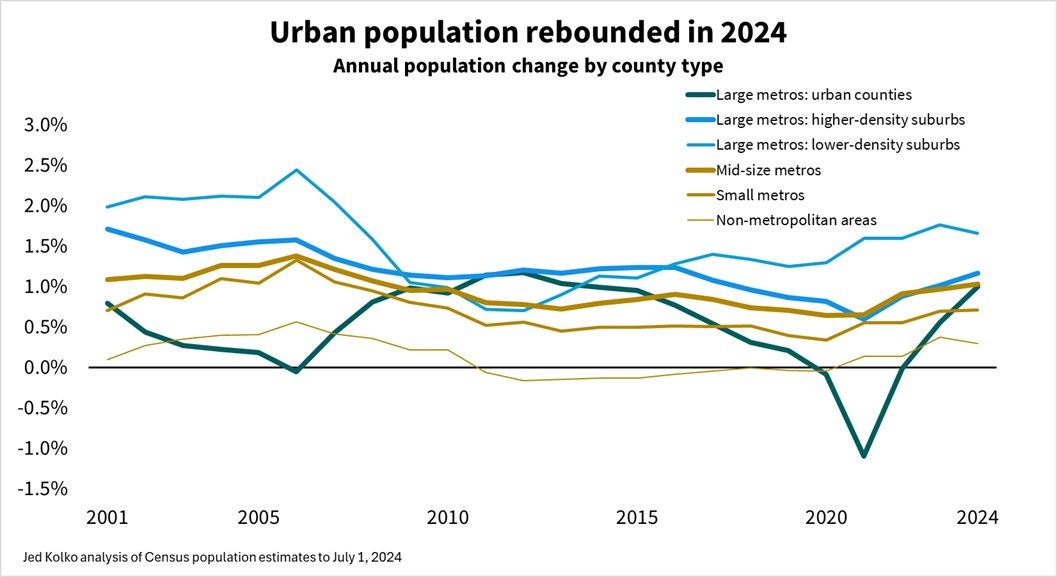
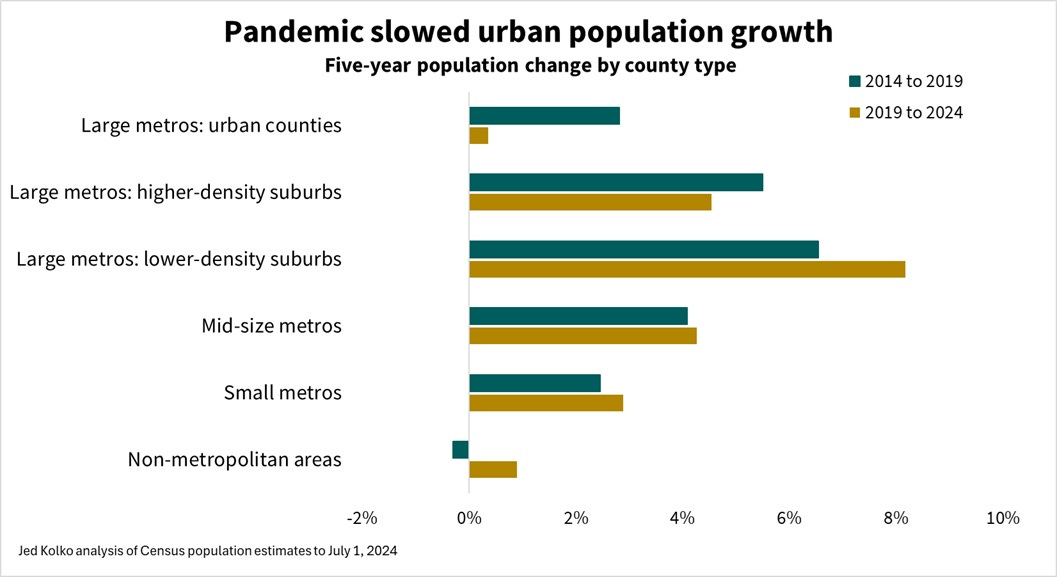
This urban rebound looks more like a temporary correction than a new normal. It follows dramatic urban population losses during the pandemic. Over the five years from 2019 to 2024 — covering the pandemic and post-pandemic years — urban counties just barely gained population, and they did so at a much slower rate than the five years prior to the pandemic. In contrast, lower-density suburbs, mid-size and small metropolitan areas, and non-metropolitan (i.e. mostly rural) counties grew faster in 2019-2024 than in 2014-2019. (Census population estimates are annual and refer to July 1 of each year. See end of post for data sources and definitions.)
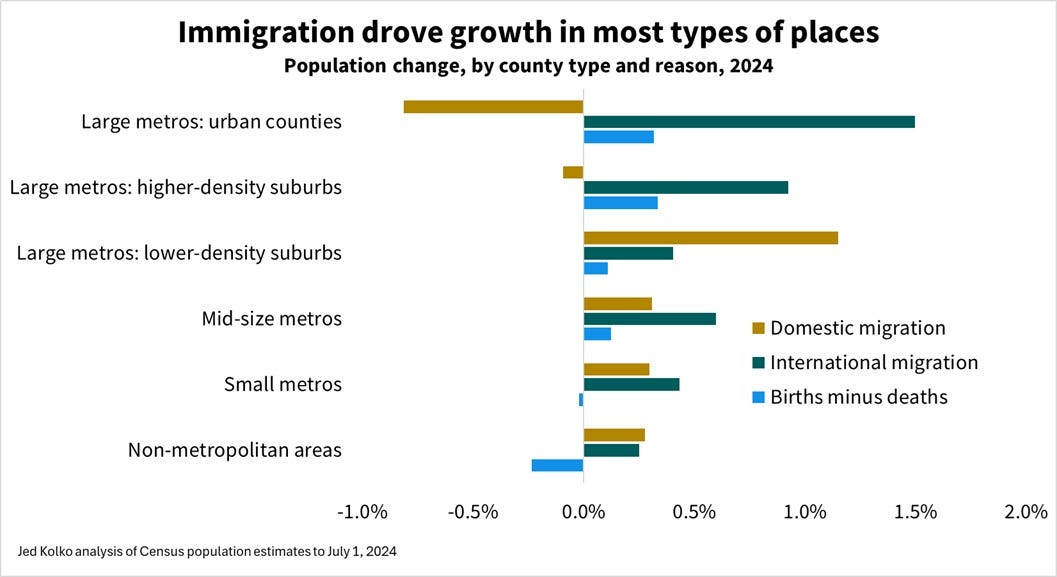
The most recent urban rebound has been fueled by the national immigration surge. The Census Bureau breaks out local population changes into three components: domestic migration, international migration (basically, immigration), and “natural increase,” which just means births minus deaths. In 2024, as in most years, international migration was highest in urban counties, while domestic migration favored lower-density suburbs and mid-size and small metros. Urban counties regularly lose people because of domestic migration. Small metros and non-metro counties gain people from both domestic and international migration, but they have older populations, so deaths exceed births.
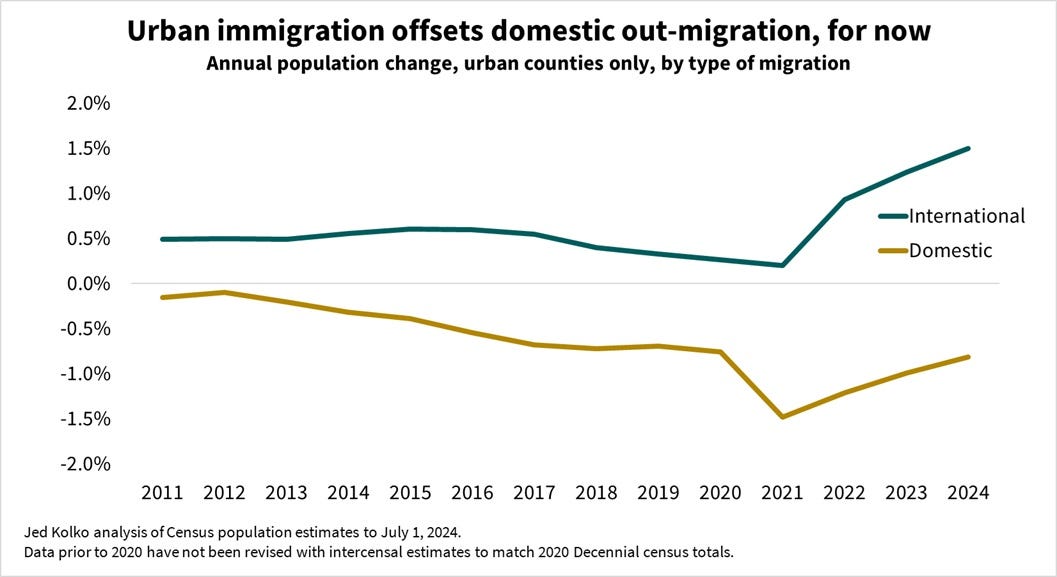
While the recent immigration surge added to urban growth in 2022, 2023, and 2024, people continued to move domestically from urban counties to other parts of the country. For urban counties, domestic migration has improved (i.e. gotten less negative) since 2021, but was still more negative in 2024 than in the pre-pandemic years.
Of course, the immigration surge is over. Border encounters have declined sharply since mid-2024, but this isn’t reflected in today’s new population estimates for 2024 since Census estimates are for July 1 of each year. Trump Administration policies are likely to reduce net immigration further, which means the urban population rebound could be short-lived if there’s less immigration to offset negative domestic migration.
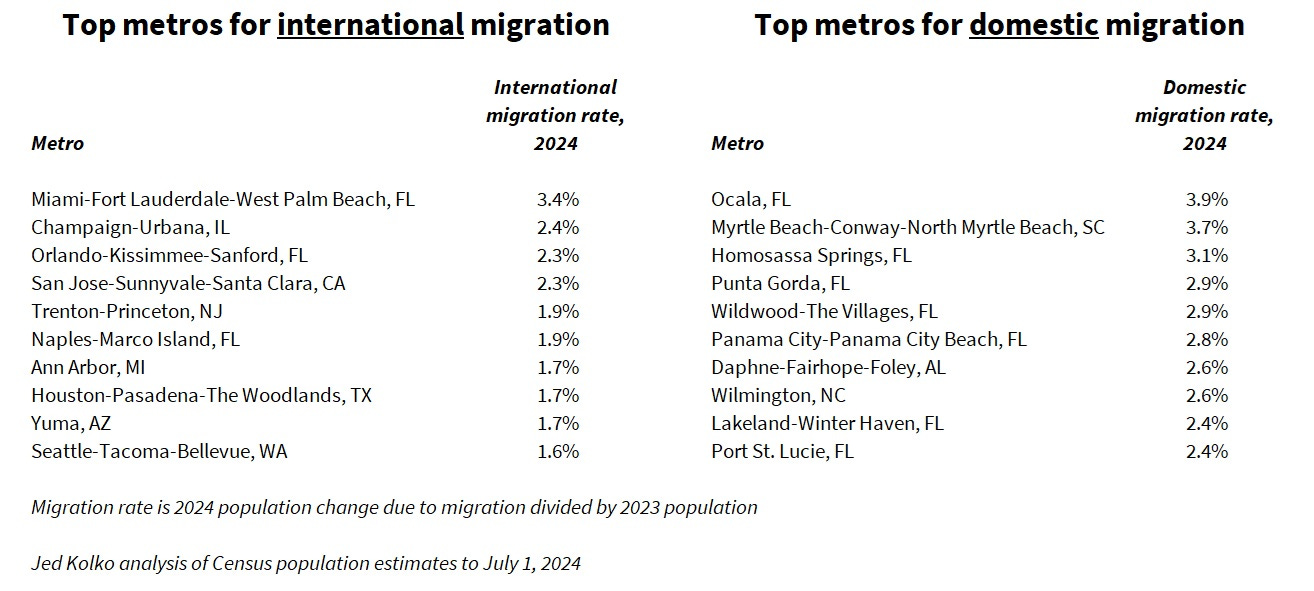
Some metros depend on immigration for population growth more than others. The New York, San Francisco, and San Jose metropolitan areas all gained people in 2024 after shrinking during the pandemic. They and other huge, diverse metros like Miami, San Jose, and Houston owe much of their population growth to immigration, as do many college towns.
The metros that grow mostly due to domestic migration would be less affected by an immigration slowdown. The biggest net-gainers from domestic migration are mid-size and smaller metros in Florida and elsewhere in the Southeast.
Among the 107 metros with at least half a million people, only three lost population in 2024, fewer than in any year since 2014. The three that lost population — New Orleans, Memphis, and Jackson MS — had only modest growth from immigration and lost people from domestic migration. Without immigration, 37 of these 107 largest metros would have lost population in 2024, including six of the largest ten: New York, Los Angeles, Chicago, Philadelphia, Miami, and Boston.
Not only might the urban rebound be short-lived; it is also probably overstated in these population estimates.
This year, Census changed its methodology for counting immigrants, resulting in a huge upward revision. Usually the Census estimates immigration based on survey data that include information on where immigrants live; but the additional immigrants included this year were based on administrative data that do not include where they live. Census appears to have assumed that the geographic distribution of the additional immigrants from administrative data is the same as those in the survey data. However, my own analysis of administrative data on recent immigrants suggests that they are less urban and more likely to live in lower-density suburbs and rural areas than the immigrants Census counts in surveys. That would mean that Census assigned too much of the 2022-2024 immigrant surge to urban counties and not enough elsewhere.
Census population estimates are comprehensive, historically revised, and use historically consistent geographies, making them analytically useful. They are also important: many federal programs allocate money based on population estimates, and the stakes are so high that localities sometimes challenge the estimates. But these county estimates also have shortcomings. Local estimates incorporate implausible assumptions about immigration; counties are large and might obscure hyper-local patterns; and estimates don’t show which demographic groups are driving population shifts. Fortunately, other data sources fill in these gaps.
Downtowns led urban growth in the 2010s but have not returned to their pre-pandemic pace
Neighborhood-level data confirm that urban America still struggles to recover from the pandemic. Growth slowed in the highest-density tracts during the pandemic years of 2020 and 2021 and has not fully returned in 2022-2024 to pre-pandemic levels.
U.S. Postal Service data reveal the number of active residential addresses (those receiving mail) in each Census tract, which are neighborhoods averaging 1,500 households. These Postal Service data have the advantage of being hyper-local, current, and comparable over time. This offers a big advantage for understanding trends in large metros that, like Los Angeles or Phoenix, contain only one or two huge counties that encompass downtowns, urban residential areas, and low-density suburbs. They also sidestep the challenges of estimating immigration because they are administrative data that count nearly all addresses.
In 2014-2019, the five years preceding the pandemic, the fastest growing neighborhoods in the US. were the 3rd and 4th deciles of Census tracts grouped by density. These include lower-density suburban neighborhoods on the outskirts of large metropolitan areas, as well as neighborhoods in smaller metropolitan areas. Urban neighborhoods, corresponding to the 8th and 9th deciles, grew most slowly, while the densest decile — including many big-city downtown tracts — grew healthily pre-pandemic.
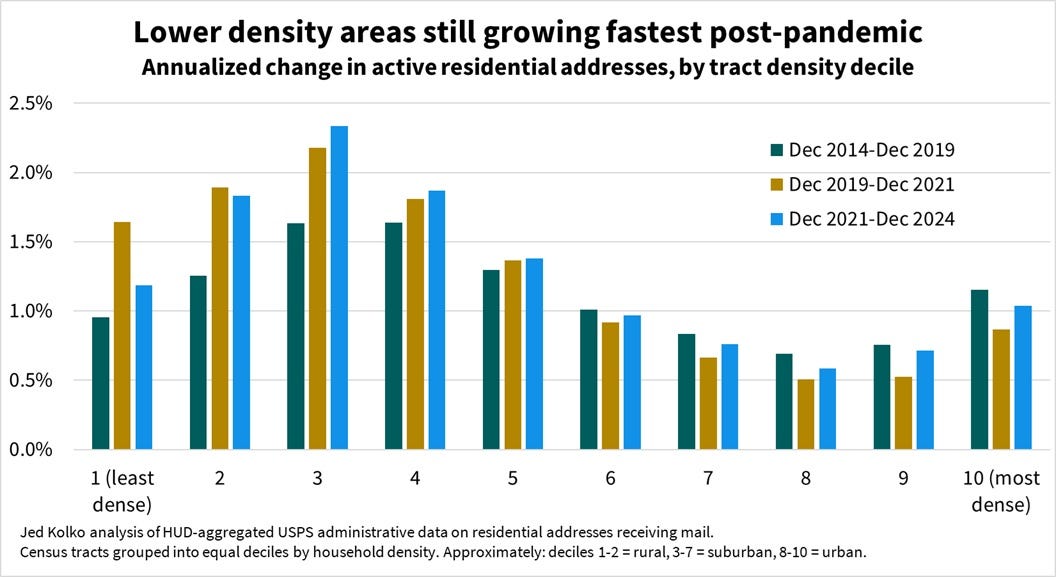
During the pandemic years of 2020 and 2021, growth accelerated in the lowest-density tracts, including rural areas (the 1st and 2nd deciles). The biggest slowdowns were in the highest-density tracts. Then, in 2022-2024, growth increased even further in the 3rd and 4th deciles — those lower-density suburban neighborhoods. Urban neighborhoods partially rebounded, but 2022-2024 growth in urban areas, including the highest-density decile, remained below pre-pandemic levels.
This means that urban growth rates are not back to where they were before the pandemic. Overall, post-pandemic growth largely follows the same pattern as pre-pandemic, but with a stronger skew toward lower-density suburbs and away from urban neighborhoods.
This national pattern holds in most large metros. Suburban growth significantly outpaced urban growth since 2019 in Austin, Dallas, Orlando, Phoenix, and other Sunbelt metros. A few metros bucked this trend with faster growth in more urban neighborhoods, including Seattle, with rapid growth around South Lake Union and the International District; Washington DC, led by growth in the Navy Yard and Southwest; and San Diego. But most metros sprawled, which is a continuation of pre-pandemic trends.
The educated young people who led the pre-pandemic urban revival are now less urban
In the years between the foreclosure crisis of 2007-2009 and the pandemic, much was written about an urban revival and (as a 2013 book put it) the end of the suburbs. Even contemporaneous data showed this to be wrong, but the germ of truth was that certain people did flock to certain urban neighborhoods, boosting demand for city living that showed up as much in rising housing prices as in new urban construction and growing populations. Poorer people got priced out of many cities, while young, college-educated adults without school-age kids moved to high-density urban neighborhoods. The urban revival was more about cities getting younger and richer than about the end of decades of American suburbanization.
But the pandemic slowed or reversed these demographic shifts.
According to the American Community Survey, the college-educated young adults who helped drive last decade’s urban revival moved away from cities during the pandemic. In 2019, 39.2% of 25-34 year-olds with a college degree and no school-age kids at home lived in urban neighborhoods; that slipped during the pandemic to 37.0% in 2023. This was a steeper decline than for the total population. These educated young adults are still more likely to live in urban neighborhoods than other people are, but by a smaller margin than before the pandemic.
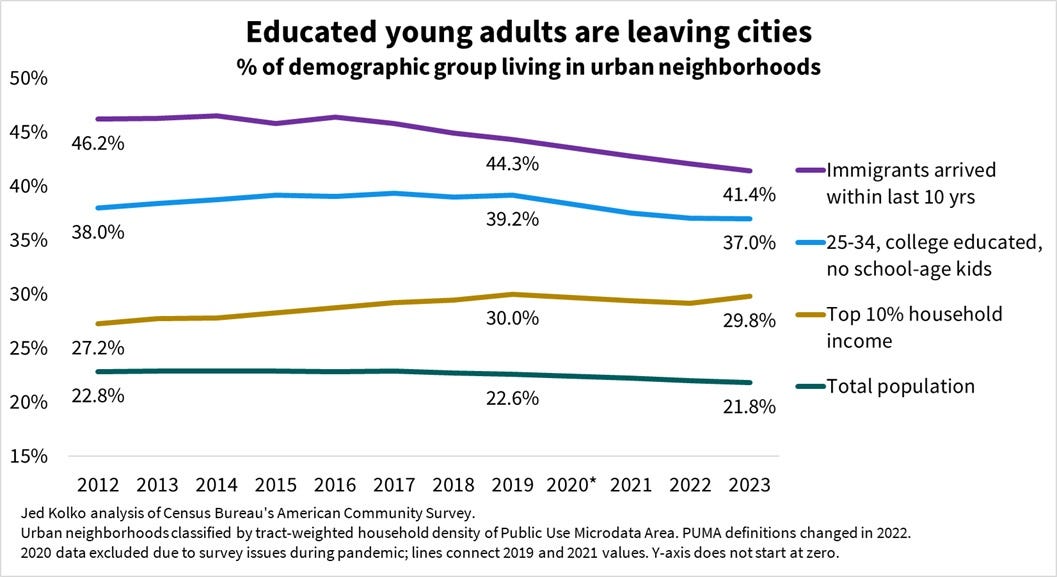
The story is somewhat different for another especially urban demographic group: rich households. In 2019, 30.0% of households with top-10% incomes lived in urban neighborhoods; by 2023, 29.8% did. The share of rich households in urban neighborhoods went down slightly in 2021 and 2022 before almost fully recovering in 2023. Still, the share of rich households in urban neighborhoods holding essentially flat between 2019 and 2023 is a change from the pre-pandemic years, when it rose steadily.
Finally, even though urban growth depends on immigration and recent immigrants remain disproportionately likely to live in urban areas, the share of recent immigrants living in urban areas continued to decline since the pandemic. In 2023, 41.4% of immigrants arriving in the US in the last ten years lived in urban areas, down from 44.3% in 2019 and 46.2% in 2012.
Slower demand, not just constrained supply, now holds back urban growth
Population changes by themselves can’t tell us where people want to live. A shift in population from cities to suburbs could mean demand for suburban living is growing faster than demand for urban living, or the supply of suburban housing is growing faster than supply of urban housing, or some mix of both. You have to look at housing prices, not just population, to infer anything about supply or demand.
According to Zillow, home prices rose 49% in rural areas and 47% in suburban areas between February 2020 and January 2025, compared with 29% in urban areas and only 10% in the highest-density urban areas. Most of this increase was prior to mid-2022. From July 2022 to January 2025, prices were up 5% in rural areas, 4% in suburban areas, and just 1% in urban areas, and have actually fallen 4% in the highest-density urban areas. What happened in mid-2022? Mortgage rates reached almost 6% then, up from 3% just six months earlier. Also, by mid-2022 remote work settled at a stable level that employers expected to maintain in the future, perhaps ending the unexpected surge in demand for housing triggered by remote work. But both before and after mid-2022, urban home prices rose more slowly than suburban and rural prices.
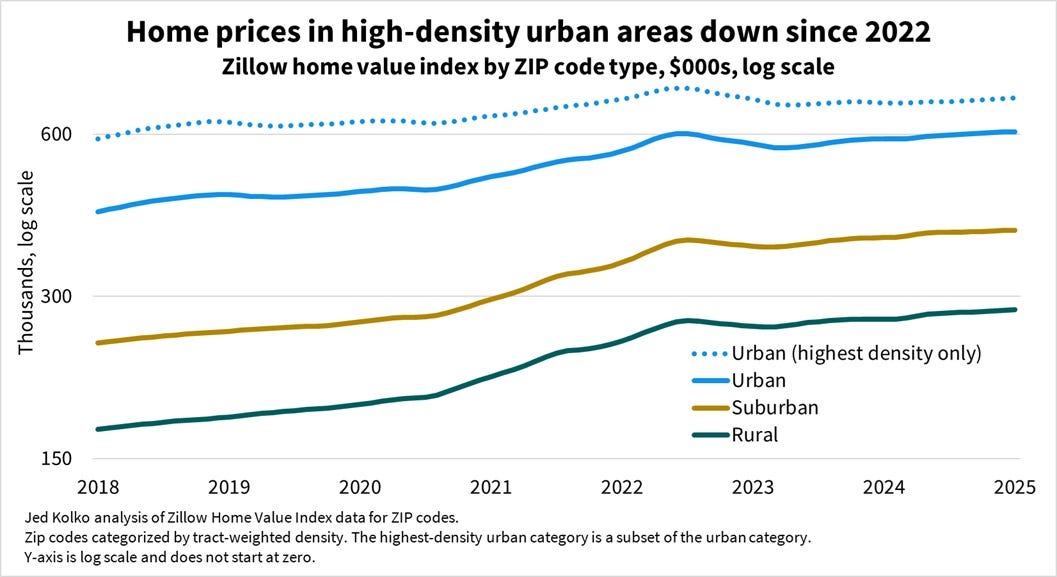
The sluggishness of urban home prices since the pandemic began, combined with the slowdown in urban population growth relative to suburban and rural areas, suggest that a drop in demand for urban living, not just constrained supply, is holding back an urban recovery. Population estimates, Postal Service records, demographic surveys, and home prices all point in the same direction: the pandemic accelerated the long-standing American trend toward suburbanization, and slowed the trends toward high-density living among the demographic groups that fueled last decade’s partial urban revival.
Methodology: defining urban areas and data sources
This post categorizes places as urban, suburban, or rural based on neighborhood density rather than city boundaries. There is no official government definition or categorization of suburbs: the government only defines urban and rural areas, as well as metropolitan areas. Many analyses of US geography unfortunately define suburbs as the portion of a metropolitan or urbanized area outside the boundary of the principal city or cities, which means Hoboken and West Hollywood are “suburbs” even though they are clearly more urban than Staten Island or the western San Fernando Valley. And wide swathes within the city boundaries of Houston, Phoenix, and many other Sunbelt cities are no one’s idea of urban.
In the absence of an official definition, surveys can reveal how people perceive their neighborhoods and what quantifiable measures predict their perceptions. In the 2023 American Housing Survey, 27% of people said they live in an urban neighborhood, 52% suburban, and 21% rural, very close to a 2015 Trulia survey. Density is the strongest predictor of neighborhood perception. Neighborhoods perceived to be urban tend to have at least 2000 households per square mile; at this level of density almost half of households live in multi-unit buildings or attached single-family homes, rather than detached single-family homes. Rural neighborhoods have densities below 100 households per square mile. Suburban neighborhoods are between 100 and 2000 (or a bit more) households per square mile.
Density can be tricky to measure, especially for larger geographic areas like counties that include both densely and sparsely settled portions. In San Bernardino CA, the largest US county by land area, most residents live in the densely populated southwest corner but most of the land is minimally populated mountains and desert. Weighted density measures handle this well: it’s the average neighborhood density for the typical household of an area, as explained on page 11 here.
Here are the data sources used:
The newly released population estimates are from the Census population estimates program, at the county level. I classify counties into six types based on the population of the metropolitan area containing the county, and density of counties in large metropolitan areas. These estimates are available annually and are revised historically, both within each decade and for previous decades. The current metropolitan area definitions are here. Population estimates are for July 1 of each year. The Census Bureau classifies migration between Puerto Rico and the fifty states plus D.C. as international migration.
Counts of active residential addresses are from U.S. Postal Service administrative data, aggregated by the Department of Housing and Urban Development, at the Census tract level, published quarterly since the mid-2000s. They are infrequently used for research but were most famously used to track recovery after Hurricane Katrina.
Demographic trends in urban residence are from Census Bureau’s American Community Survey microdata, accessed via IPUMS. The method for classifying respondents into urban and higher-density urban neighborhoods is described in an earlier post using the same method: Urban Revival? Not for Most Americans. This analysis uses Public Use Microdata Areas, which are geographies designed for the ACS that contain at least 100,000 people; these are the smallest areas for which individual-level data are publicly available.
Home prices are from the Zillow Home Value Index, at the ZIP code level, which I classified into urban, suburban, and rural based on tract-weighted density.
For all data sources and levels of geography, I use 2020 Census tract household counts and land area to calculate tract-weighted densities.
It's a shame we invented the perfect dense-but-not-too-dense urban form with the streetcar suburb -- just look how pricey and popular the extant ones are today! -- and then decided 'nah, we can do worse than that.'
I’m not sure I buy the assertion that slower home price growth in urban areas is a sign of lower demand. Urban areas (particularly coastal ones) have higher prices to start with, so the lower percentage growth may still represent larger absolute dollar increases.
Here’s a hypothesis: more people are priced out of urban areas due to high mortgage interest rates and little to no new supply, so they have no choice but to decamp for the suburbs.
How have rents changed? I would have liked to see that in the analysis.