
Housing inflation is higher than the Fed thinks — but already falling
So much depends upon the choice of a price index

According to the latest national rent data from Apartment List, “year-over-year rent growth currently stands at a staggering 15.3 percent, but is down slightly from a peak of 17.8 percent at the start of the year.” This is part of a 2022 trend in which rent hikes — while still large — are smaller than they were in 2021.
And on its face, this seems like good news for Jay Powell. High levels of rent increases confirm that raising interest rates is the correct course, while the fact that inflation is already moderating compared to last year suggests that its odds of success are good.
Unfortunately for Powell, the Bureau of Labor Statistics, which calculates the official Consumer Price Index, has a totally different story.
The BLS says that the most recent year-over-year rent increase was 5.2 percent, which is not only lower than the Apartment List number but a significant acceleration from only 1.8 percent a year ago.

So what’s the deal? How can rent growth be accelerating in the BLS data and decelerating in the Apartment List data?
There are a lot of technical differences between the two series, but the important one is that Apartment List looks at prices paid on new transactions each month while the BLS tracks the average of all rents.
So Apartment List shows that growth in the price of new leases peaked late last year and is now slowing down. But the BLS still has those leases in its national average, which is continuing to rise because old leases from early 2021 are now rolling out the average. In a time of economic turbulence, spot rents and average rents can move very differently.
Which method is better depends on the question being asked. The BLS approach provides, I think, a clearer picture of the evolution of living standards in the United States. The huge plummet in the asking rent for vacant units at the depths of the pandemic did not generate large real income gains for most Americans because very few people actually signed new leases during that moment. And by the same token, the insane surge in spot rents in the summer of 2021 was not a sudden and dramatic blow to Americans’ living standards because, again, very few people actually signed new leases during that moment. The aggregate ups and downs of housing costs are more gentle, as the BLS says.
But for managing the economy in real time, I think the Apartment List metric is superior. And Apartment List is saying that demand was screaming hot in the summer of 2021, even for things that were not particularly related to any supply-chain disruptions, and it’s saying that while demand remained hot as of last month, it had already cooled quite a bit.
This methodological disagreement matters a lot
A broadly similar issue arises for all kinds of long-term contracts like cable and cell phone bills, but those are really small items that don’t make a big difference to the overall inflation picture.
By contrast, rent is by far the most important variable in the overall inflation measurement. That’s especially true when you’re talking about so-called core inflation, which the Fed usually is. Core inflation throws out food and energy prices, which annoys most people because, for a typical person, these are the most salient prices of all. The justification for tossing them is that commodity markets are subject to rapid price swings based on global conditions — the Fed isn’t saying they aren’t important (they clearly are important), they are saying that adjusting aggregate domestic demand in response to global commodity price swings would generate a less stable economy rather than a more stable economy over the long run.
Once you toss those, housing dominates the core CPI.
And the way the American government calculates housing inflation is all about rent.
The calculation involves two items. One item — the one that’s most comparable to Apartment List’s concept — is called Rent of Primary Residence. This is the rate that renters pay to rent the house that they live in. The other is called Owners Equivalent Rent. OER is the rate that homeowners pay themselves in their capacity as their own landlord. That is a confusing and weird idea that cannot be directly measured. But basically what they do is look at the characteristics of owner-occupied housing and then at rents paid for similar dwellings on the rental market. They use that to calculate what my house would rent for if I moved out and put it on the market. So renters and homeowners alike are stipulated to have housing as our largest expense, and the nature of that expense is calculated based on average rents. And average rents move slowly by definition because they are an average.
But over and above the fact that most leases are at least somewhat long-term, a further feature of the housing market makes average rents a sluggish indicator: vacancies are expensive. Having a tenant move out and then needing to clean the unit, list it, show it, etc. is a pain in the butt and can cost you 1/12th to 1/6th of your annual revenue, even if things go well. A landlord with a decent tenant who pays the rent on time is going to be restrained in terms of rent hikes compared to one with a vacant unit. And the reverse is true on the way down. In a weak market, a landlord may discount generously for new tenants because leaving units vacant is expensive, but he’s not going to proactively offer discounts to tenants just to be a nice guy. The result is relatively gentle shifts in average rents relative to the actual conditions on the spot market.
A destabilizing distortion
During the so-called “Great Moderation” era of American macroeconomic policy when we didn’t have any huge ups and downs of inflation, the difference between these two numbers wouldn’t have been particularly large. And focusing on the more gently rolling average rent method also reenforced the moderation. You’re already telling people that monetary policy should ignore the highly volatile food and energy commodities, and then with housing as by far the largest element of the remaining “core” CPI, you are defining housing costs in a way that the price is unlikely to change quickly. That means measured inflation is always very stable, which leads people to expect stable inflation in the future. Those stable inflation expectations, or so the Fed believes, help to make inflation actually stable.
It’s a kind of virtuous circle of stability.
The trouble arises when things are not stable, as during the rapid collapse of the demand side of the American economy in 2008. As the Great Recession was building, commodity prices were actually very high, which made the Fed somewhat reluctant to cut interest rates. And core inflation wasn’t plunging, in part because with housing inflation measured by average rents, it literally couldn’t plunge — there are so many old leases in the data that there’s no way for CPI rent to exhibit a sudden fall. But when demand actually is collapsing, failing to pick up on that in real time leads to under-reaction and trouble.
Last year we saw the same problem in reverse: spot rents were soaring, but average rent can’t soar, so the Fed was slow to acknowledge how much demand was overshooting sustainable levels. Then because the Fed was too slow to start raising interest rates, they are now hiking very quickly. But again, because average rents can’t stabilize quickly (they necessarily move slowly and with a large lag), there’s a huge risk that the Fed will end up overshooting in the other direction and keep raising rates even once demand has been adequately squelched.
Long story short, while during placid times the average rent measure reinforced the placidity, it has the opposite effect during unstable times, encouraging the Fed to underreact and then oversteer, and leading people to learn over time not to trust monetary policymakers.
Other ways to measure
It’s worth saying that there are even more ways to measure housing inflation.
The European Central Bank, for example, uses what they call a “net acquisitions approach” to measure the cost of owner-occupied housing. What this amounts to, as I understand it, is a measure that subtracts the cost of land from the purchase price of newly built homes while totally ignoring the price of homes that are bought on the secondary market (i.e., most homes) but including maintenance costs.
The net acquisitions approach adopted by Eurostat measures the costs associated with buying and maintaining the housing structure: it captures changes in transaction prices in respect of dwellings that are new to the household sector, and it considers other goods and services purchased by owner-occupiers. It excludes transactions between households and it also excludes the land component, as this latter is not considered as part of the consumption-related expenditures that the HICP [Harmonized Index of Consumer Prices] aims to capture.
They offer various theoretical and practical reasons for the superiority of this approach, but fundamentally it stems from a statutory requirement to avoid statistical imputations.
Up until 1983, the U.S. used a method that Timothy Lee and Aden Barton recently explained. Under the old system, “the inflation rate for owner-occupied homes was calculated based on actual spending by homeowners: the purchase price of the home, mortgage interest payments, property taxes, and so forth.”
Conspiracy-minded people sometimes allege that the methodological switch to OER was a plot to hide the true amount of inflation. That’s not correct; over the long term, inflation comes out about the same under either method. The difference is that the old way showed much more volatility.
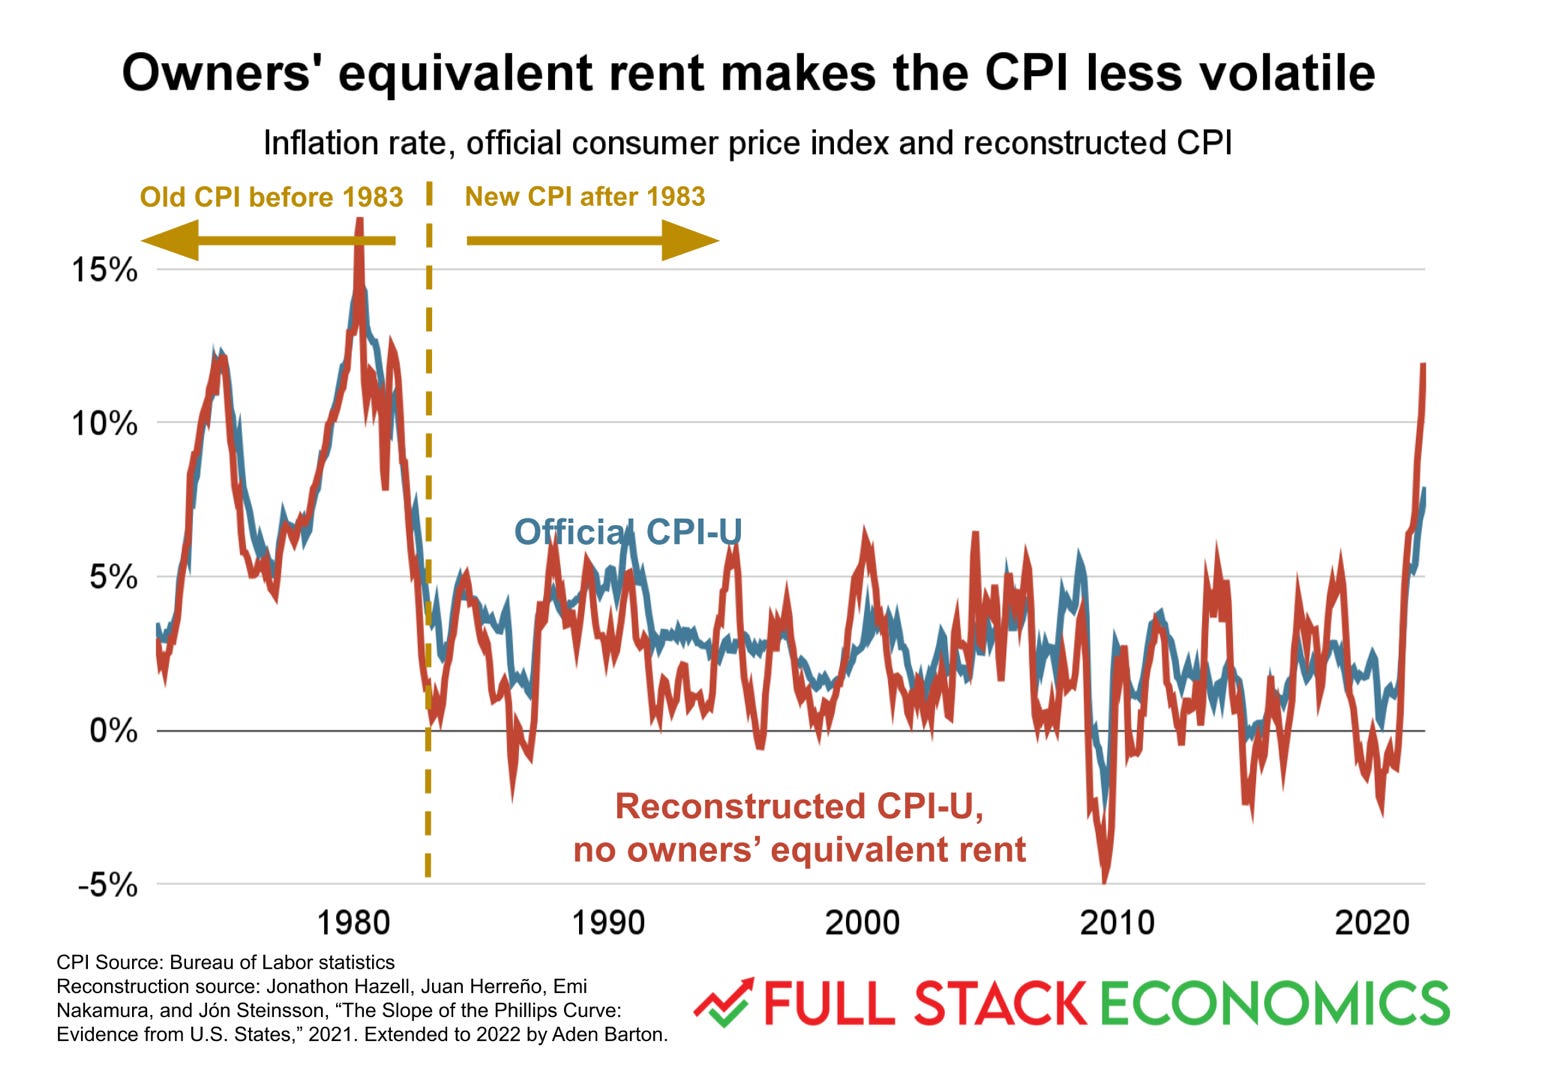
One thing that’s important about this is that both the HICP method and the old Fed method lead to a tighter link between monetary policy actions and inflation. When the Fed raises interest rates, home prices tend to fall. The way the Fed’s old method worked, that fall in home prices meant that housing inflation was easing.
But under the new method, the price of houses is not relevant to the housing component of inflation. Only average rents matter. Housing inflation falls when people start losing their jobs and moving back home with their parents, thus driving up vacancy rates. And even then it falls slowly because even if landlords with vacancies on their hands start cutting rents steeply, average rents won’t move for months and months. Central bankers often say that monetary policy operates with “long and variable lags,” and measuring inflation in the modern American way essentially guarantees that the lags will be long.
Why doesn’t anyone just track home sale prices?
I think this all sounds bizarre to most people, since we’re used to hearing all the time about the ups and downs of the housing market measured just by the sale price of homes. Yet none of the three central bank methods directly look at this:
Current U.S. practice entirely ignores the sale price of homes, referring exclusively to imputed rents.
Current European practice does look at the sale price of homes, but only of new ones, ignoring the majority of homes and also trying to take land prices out.
Past U.S. practice looked at monthly payments rather than sticker prices, so it was a mixed blend of the house costs plus mortgage interest rates.
This all speaks to the fundamental difficulty that the housing sector is odd.
What we are trying to measure with our inflation index is the price of consumer goods, so we ask what a table costs, not what it would cost you to buy a table-making factory. Producer costs have some influence on consumer prices, of course, but the thing we are measuring is the cost to consumers.
The issue with housing is that a house is essentially a “housing factory” that produces “housing services.” In Manhattan, where most people rent shelter from a commercial landlord, this all lines up nicely with the needs of government statisticians. Buying an apartment building (a housing factory) is an investment play, and the price doesn’t belong in a consumer price index. If you want to know about consumer prices, you just measure the rents.
But when a majority of people are living in homes that they own, the situation is ridden with ambiguities.
We need a better target
I’ve long thought that one of the best reasons to prefer a policy regime that targets nominal gross domestic product — the aggregate amount of dollars spent in the economy — over one that targets inflation is that there are many fewer conceptual issues with the measurement.
I wouldn’t want to overstate the case and say there are no measurement issues with NGDP, but they are much smaller.
This whole post has been about housing, but in an economy that’s increasingly dominated by personal services, there are a lot of very fundamental questions about how to do quality adjustments, and NGDP targeting lets you bypass them. As it happens, we have just been through an economic cycle where inflation was dominated first by durable goods, then by a shock to food and energy prices, and now by a lot of concern over the housing sector. But someday the measure of inflation in personal services may become very important, and people are going to realize that we’re doing a bad job of measuring this — not because the BLS is making any clear methodological mistakes, but because it’s very hard to know the right way to do it.
But that switch is the kind of wrenching conceptual change the Fed is reluctant to make.
And as long as we’re sticking with trying to measure inflation, I think it’s important for central banks to be clear about what it is they are interested in. The Fed isn’t trying to ascertain what a fair cost-of-living adjustment is or devise an appropriate deflator so we can compare movie box office records from different eras. They are interested in inflation because they are trying to set interest rates in a way that stabilizes the economy. For that purpose, I think looking at spot rents — trying to copy the Apartment List method in a nationally comprehensive way — would be a lot more useful than the current reliance on average rents.
Right now, using spot rents as a housing cost measure would tell us that inflation is higher than the Fed thinks, but also that it is slowing down rather than speeding up. In the particular circumstances of June 2022, those are offsetting errors, so it superficially doesn’t matter. But in a few months those lines are going to cross, and the reliance on average rent is going to push the Fed into a policy mistake just as it did last year — except in the opposite direction.
This article is a long-winded way of saying the housing measure in the Feds inflation index calculation is a lagging indicator (because it is more of a long-term average instead of short-term snap shot). You do a good job explaining that and suggest that a different number might be better (though possibly “noisier”). I don’t know enough to argue for or against a change, but I do have a question that the article does not address.
The Fed managers surely know that it is a lagging indicator, is it your position that they are too stupid or too rigid to let more time sensitive data affect their decision? Or is it obvious (from past moves) that they have not considered it? In other words, the measurement has its flaws (like every other aggregate index) but would a change make a difference in the decisions that are made?
I’m not trying to me argumentative or dismissive of your point. It is an honest question because I don’t know anything about what drives the Fed.
Just as a data source for those curious: AEI's housing center sucks up a big pile of data and has it in some (potentially) useful formats -
https://www.aei.org/housing/housing-market-indicators/
Focused on housing sales and related items, while also making clear that housing markets vary wildly across geographic areas even though there is some coupling to broader economic trends.